

Part 2 – Six Elements of Project Controls; Quality
By Lance Stephenson, CCP FAACE
In August 2021, I provided a short article on the six elements of project controls. The previous article provided a summary overview of the elements required for successful project delivery. In today’s article, I will briefly discuss the quality measures required to further support the value that the six elements of project controls bring to an organization. This article also discusses the impact that errors have on impeding project success, and that errors in project controls can cause a cumulative effect with respect to the downstream problems that can occur if not adequately and timely identified and addressed.
To briefly recap, the six elements of project controls can be considered the operational steps for managing the functional project controls requirements within a project. These six elements also relate to the project controls processes within AACE International’s Total Cost Management Framework. The six elements of project controls are represented in Figure 1. The bubbles in the diagram represent the six elements while the information provided above and below the arrows represent the key deliverables and measurements.
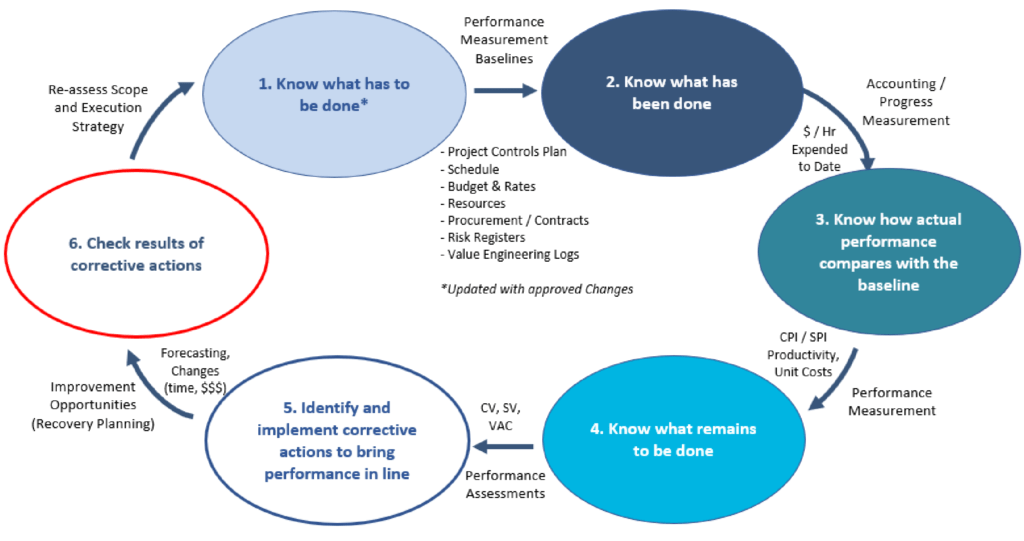
Figure 1 – Six Elements of Project Controls
Quality is simply defined as the degree of excellence; a grade; albeit a subjective grade as defined by Webster’s Dictionary, https://www.merriam-webster.com/dictionary/quality. In this particular case, I will be discussing the quality of project controls work required to properly execute a project, and not the end-quality of the physical elements of a project. With this said, work quality is considered the value of work delivered by an individual, team, or organization. This includes achieving the following features for any tasks or deliverables.
- Fit for purpose – where the task or deliverable meets its defined purpose, function, and standard as defined by industry best practices, contracts, policies, and procedures. This includes attaining the required level of detail and thoroughness that meets the complexity, criticality, and urgency of the project. Establishing “fit for purpose” for project controls deliverables can be the most difficult and ambiguous characteristic to determine, as organizations and people within the food chain of project delivery will interpret requirements differently (a client may require a level 2, cost loaded schedule while the contractor may require a level 3, resource loaded schedule).
- Conformance to requirements – where the criteria of the required specifications are met.
- Correctness and completeness – where the task or deliverable are considered error-free and there are no missing parts.
- Consistent, accurate, and timely – where the task or deliverable is completed in a consistent (standard approach), accurate (validated), and timely matter (desired frequency).
In a perfect world, we would expect that the highest quality should be achieved. However, we don’t live in such a world. While it is good business to strive for attaining the highest level of quality, there is a cost in doing so. Equally so, there is a cost when poor quality is ignored, and errors occur. These two quality factors, good and poor, are identified as the cost of quality. The cost of good quality is comprised of both prevention costs (costs incurred specifically designed to prevent poor quality) and appraisal costs (costs incurred to maintain quality levels, i.e., measure, inspect, evaluate, and audit). The cost of poor quality is comprised of both internal failures (re-work, improper use of processes, ineffective training, and poor productivity) and external failures (costs associated with defects).
The cost of quality is represented in Figure 2. By properly injecting costs to increase measures that prevent errors, the cost of failures and appraisals are greatly reduced. The total cost of quality is displayed similar to the bathtub curve, which does not depict the costs of a single item but represents the relative costs of both good and poor quality.
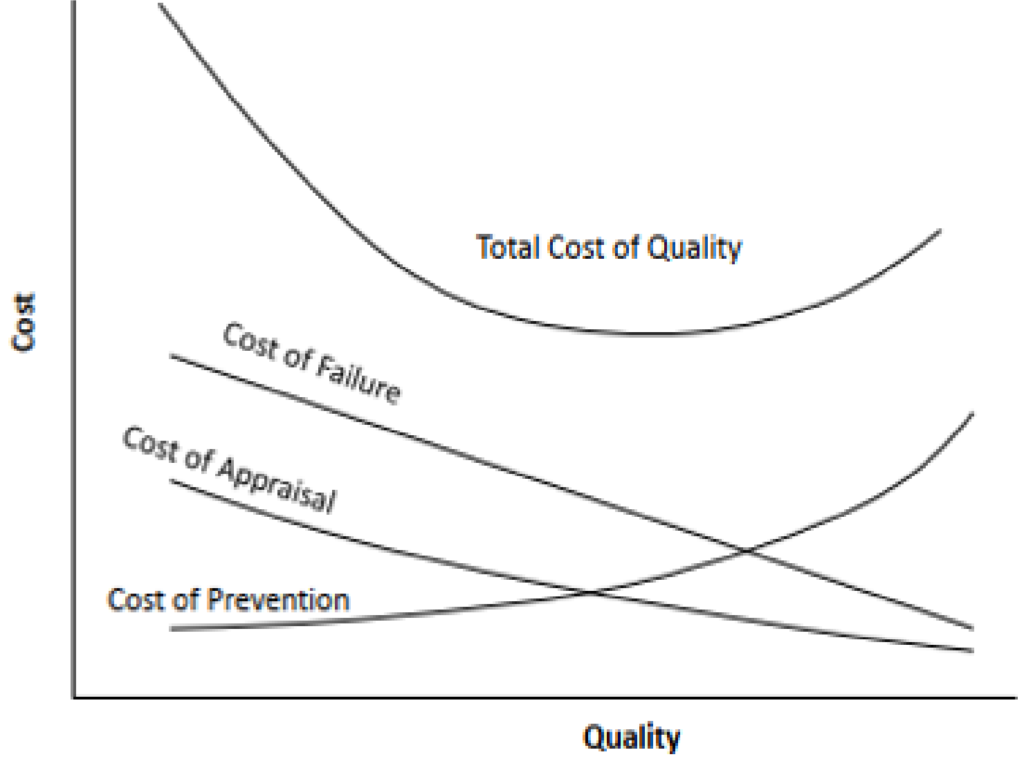
Figure 2 – Cost of Quality Concept (AACE International’s TCM Framework, 2nd Edition, page 125)
The purpose for achieving a higher level of quality, specifically around project controls, is to improve the decisions made as the project progresses from planning to execution. To assist in understanding the effect quality has on project, the stock and flow diagram within a systems dynamic model is used as an example. For the purpose of this article, a simple illustration of a stock and flow structure of the systems dynamic model is provided to demonstrate the cause and effect of quality, errors, and rework that can contribute to chaos and unpredictability within the project controls domain. This influence of the systems dynamic model is not presented.
System dynamics models are continuous simulation models using hypothesized relations across activities and processes. For instance, the lack of skills and knowledge of project controls, scope of work ambiguity, or even workload can affect the quality of the deliverables. These models can also validate that the processes will meet the expectations of functionality and maintainability while addressing all the key risk areas. Figure 3 represents an example of the typical project stock and flow structure of a system dynamics model. As presented in Figure 3, the traditional sequence of a project is to identify the work to be completed, the work in progress (execute the work), and identify the work that has been completed.
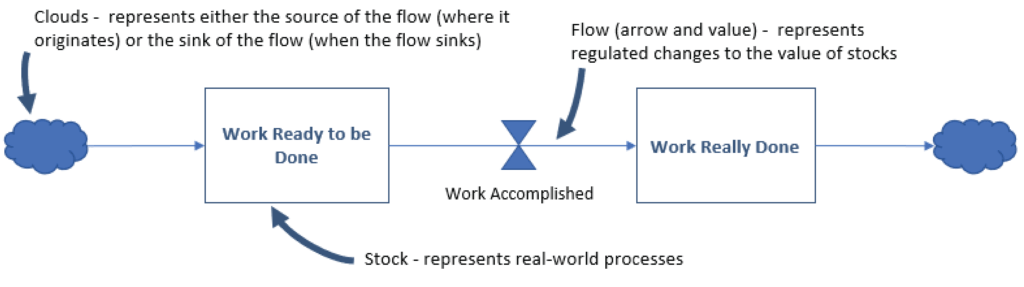
Figure 3 – Project Stock and Flow Structure of a System Dynamics Model
It is expected that the work accomplished will be completed error-free. If the tasks are done incorrectly, errors are generated, creating rework loops. This concept is illustrated in Figure 4. Once an error has been discovered, rework is allocated, assigned, corrected, and completed.
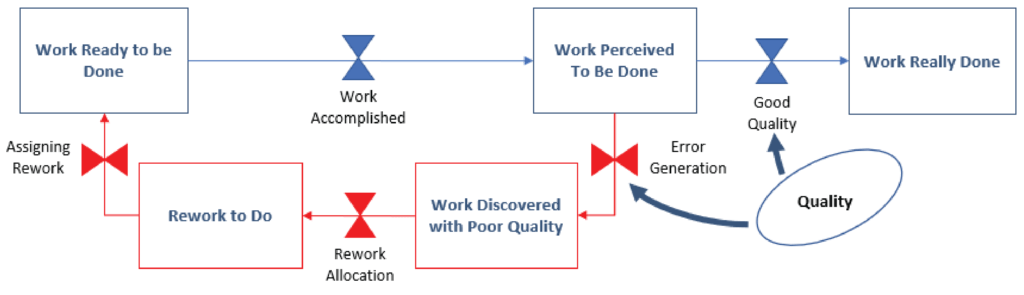
Figure 4 – The Rework Cycle (See Applying Earned Value Management to Design-Bid-Build Projects to Assess Productivity Disruption, Dr. Stephen P. Warhoe, Page 187)
If an error is identified within one or more of the six elements of project controls, the rework cycle is activated. Figure 5 illustrates the rework cycle that is nested between the elements know what has to be done and know what has been done.
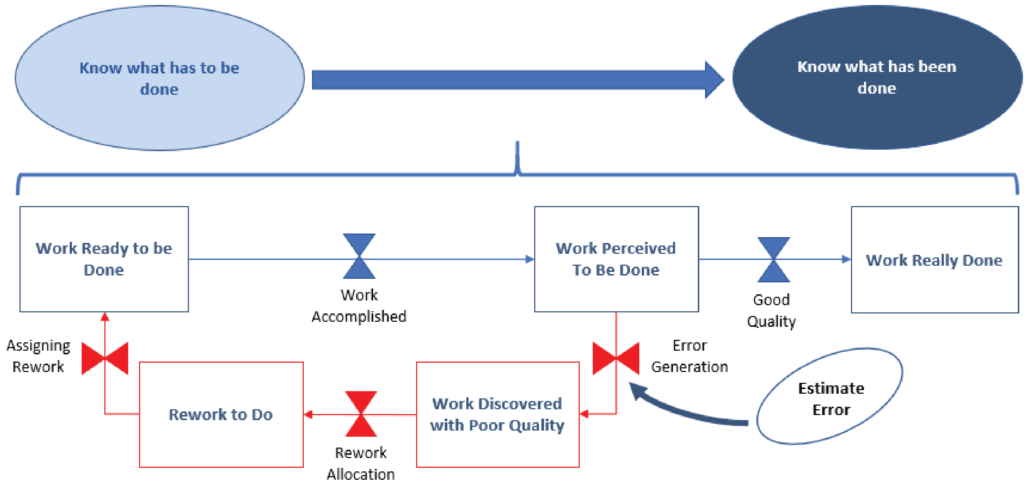
Figure 5 – Rework Cycles within the Six Elements of Project Controls
As depicted in the figure, an error in the estimate was identified, triggering the rework cycle. The estimate is considered one of the key deliverables for developing the performance measurement baselines (PMB’s) of the first element, know what has to be done. If this deliverable is incomplete or done incorrectly, there is a compounding effect to the overall quality. For instance, for the schedule to be correct and complete, the estimate needs to be correct and complete. These two deliverables (among the other planning deliverables identified in the project controls process map of the TCM Framework) are simultaneously involved in an iterative, concurrent process. If the estimate is incorrect, then the resources required to complete the work would be incorrect. Incorrect resource assignments would affect the activity durations and the subsequent timing of the starts and finishes of activities within the schedule. This in turn would misrepresent the need for when work is to be executed and procured items to be delivered, etc.
Other considerations are when errors are not identified in a timely fashion, or not found at all (i.e., undiscovered rework. Undiscovered rework is considered unidentified information. Such information will exist and would be relevant to the project team, however, the specifics of the rework are completely outside of their scope of awareness). These situations could reduce the credibility, integrity, and trust of both the individual and data. As a result, the decision makers may start collecting their own data (in an effort to reduce misinformation), which could be more disastrous to the outcome of the project. This outcome would also add unwanted conflict and disfunction amongst project team members and possibly, the client.
Ultimately, if any information is incorrect, incomplete, and not identified in a timely fashion, a cascading or ripple effect to other activities will occur. This is because almost every task or deliverable within each of the six elements of project controls has a causal relationship between the other elements, which can directly or indirectly affect downstream activities. A causal relationship exists when one variable in a data set has a direct influence on another variable. This creates a more pressing issue as decisions are based on the perception that the information is timely and correct. If the basis for one decision is incorrect, based on these causal relationships, the basis for a subsequent decision will most likely be incorrect. If not identified and corrected, one error can lead to another, bigger error, which can lead to a compounding effect of errors. When this situation occurs, organizations struggle with the ability to identify, prioritize, and focus on corrective actions. This further introduces the dangers of doing too many things at once, paralyzing their efforts. Chaos ensues. What was once a simple project has now turned into a complicated or overly complex one. In some cases, the project has failed before it has even started.
In order to prevent quality issues within the project controls domain, the causal relationships between the six elements are identified in the following diagram, Figure 6. This diagram is considered a static design structure matrix, which provides a simple representation of the complex system of project controls. The matrix is a two-dimensional matrix that identifies the primary variables (i.e., six elements) along the left side and top of the matrix (e.g., know what has to be done = 1, etc.). Reading across the element row and then scanning down the column based on the arrows identifies the relationship to the other elements. For instance, the quality of element 2, know what has been done, is dependent on the quality of element 1, know what has to be done. Subsequently, the quality of element 3 is dependent on the quality of both elements 1 and 2.
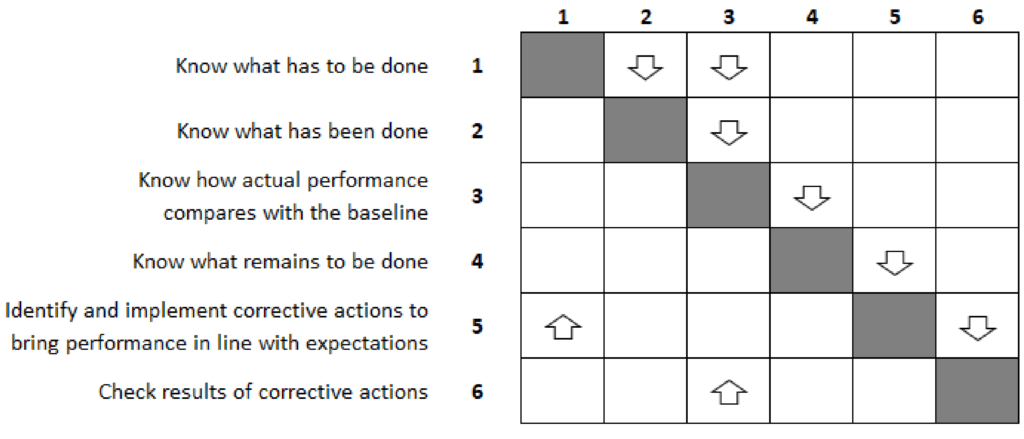
Figure 6 – Matrix Relationships of the Six Elements of Project Controls
Understanding causal relationships via the static matrix as illustrated can have a profound effect on the decision-making process, and ultimately, the success of the project. Decisions that are made without consideration of these causal relationships will only compound and exacerbate the situation. These wrongful decisions can have a major influence on the project’s remaining work, creating further obstacles that would limit success. As an example, a project team received information that identified the rebar installers were performing at a favorable rate in one specific work area. A decision was therefore made to move some of these installers to another work area that was trending behind with respect to productivity and schedule expectations. Unfortunately, the information received by the decision makers was in fact incorrect, and the installers that were thought to outperforming expectations were actually underperforming in the first specific work area. As a result of removing some of the workers from the first area, it was placed in further jeopardy of being completed on time. As a result of the decision that was made, and in an effort to regain lost time, the management group decided to increase resource labor (more installers) and extend workday hours (overtime). These decisions introduced fatigue, congestion, and safety issues, which lowered productivity rates even more, and increased risks and costs. These decisions negatively impacted downstream activities.
So, what can we do to minimize errors that may occur during the planning and execution of a project? First, organizations need to comprehensively evaluate the quality of the deliverables to determine where these errors may occur. The following table is an example of a quality audit that was performed on element 1, know what has to be done. Areas of improvement are identified so that the project team can introduce corrective actions. For instance, the schedule met the expected standard for fit for purpose (the schedule was developed at the appropriate level). However, improvement was needed to ensure that the schedule was in conformance to requirements (the schedule was technically sound but not resource loaded) and consistent, accurate, and timely (the schedule was not validated). Finally, the schedule was deemed unsatisfactory as it was not correct and complete (where it was identified that there was missing scope and subcontractor work, which put the critical path into question). Completing a project controls attestation at the beginning and during the execution (for each element within each project) promotes a healthy approach to project delivery and will minimize errors and rework.
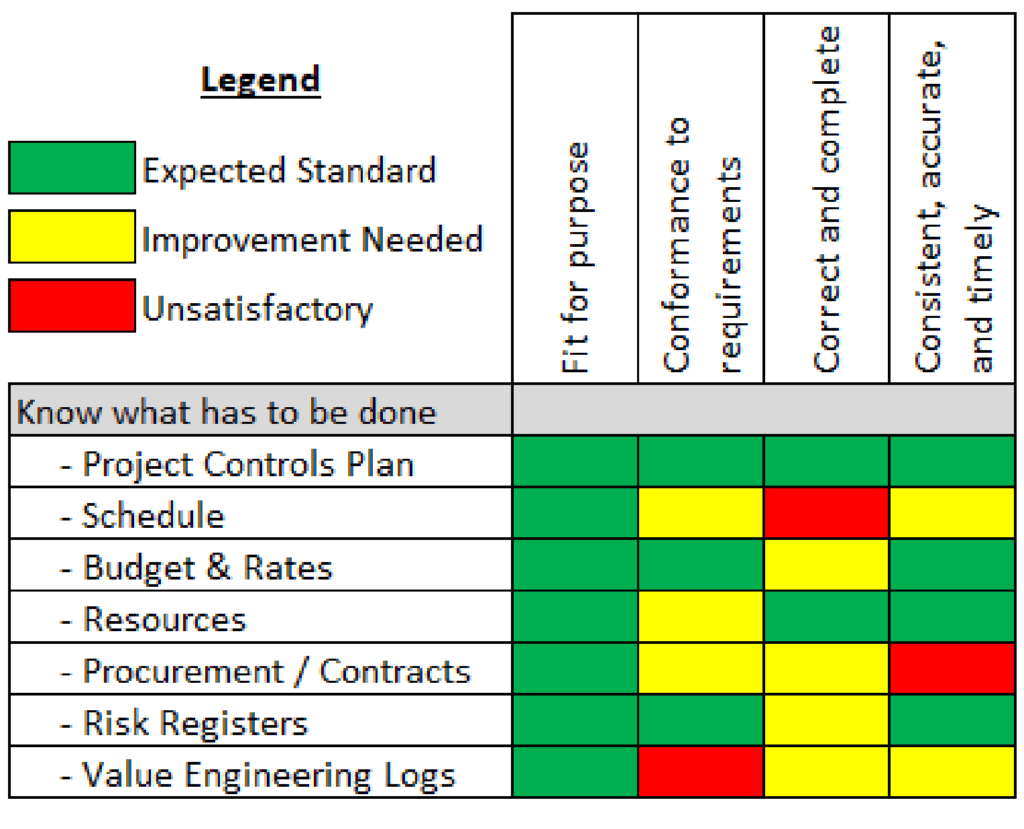
Table 1 – Example of Quality Assessment Table
Second, the organization should identify any systemic issues that are prevalent within their respective project delivery systems. Systemic issues are flaws that are inherently due to the background conditions in the overall system itself. A change to the structure, organization, or policies could alleviate the systemic issue(s). The following are high level systemic issues that have caused errors and rework that have plagued many organizations.
- Management Issues – looks at project controls as a cost rather than a value, undermines the ability to introduce effective and efficient personnel, processes, and systems; lack of proper and functionally accountable management and supervision, poor coordination or unclear instructions to team members.
- Personnel-Related Factors – lack of experience and knowledge of the project controls process, lack of proper involvement in the project, inadequate briefing and communication with project team; lack of funding to provide the appropriate surveillance and governance (not part of the project estimate).
- System-Related Errors – lack of a mature project controls ecosystem that provides timely information; diminishes the project controls efforts to data collection and reporting, creating an inability to analyze the information; outdated or poorly working tools such as software and hardware.
- Process Related Errors – inferior workflows, role assignment, and approvals, which hinder the decision-making process. Improper project set-up, from defining the WBS to onboarding personnel and contractors.
While the list provided are just a few of the main areas where systemic issues occur, organizations should complete a deeper investigation to determine the specific root causes that inhibit their successes in project delivery.
The function of project controls is simple but complex, yet essential for project success. The function of project controls is basically a large math exercise comprised of equations and algorithms, probabilities and what-if’s, complemented with relationships and interdependencies. How we manage this exercise within the six elements of project controls will determine the number of errors and rework that may occur.
Rate this post
Click on a star to rate it!
Average rating 5 / 5. Vote count: 14
No votes so far! Be the first to rate this post.